In retail, understanding and leveraging data is crucial to staying ahead of the curve. Retail analytics empowers store owners to make informed decisions that drive sales and improve customer experiences. Leveraging planogram analytics has become essential for store owners aiming to maximize sales and optimize the shopping experience. A planogram is more than just a visual representation of product placement—it is a strategic tool that can significantly impact your store's performance. By tracking key metrics related to planograms, store owners can gain valuable insights into product performance, space utilization, and customer behavior. Here are the crucial planogram retail analytics metrics every retailer should monitor:
- Product placement effectiveness: Product placement is the heart of any shelf space planning. Monitoring the effectiveness of where products are placed on shelves can provide insights into which locations generate the most sales. For instance, products placed at eye level or in high-traffic areas often perform better. By analyzing sales data in relation to product placement, you can identify optimal locations for high-margin or high-demand items. Understanding the impact of product placement allows you to optimize shelf space, ensuring that the most profitable products are in the most visible and accessible locations.
- Space elasticity: It measures the connection between the amount of shelf space allocated to a product and its sales performance. This metric helps store owners determine if increasing or decreasing shelf space for a particular product will lead to higher sales. For example, if a product's sales significantly increase when given more shelf space, it may be worth reallocating space from underperforming items. Maximizing space elasticity ensures that each inch of your shelf is contributing to overall profitability, leading to more efficient space utilization.
- Planogram compliance: Planogram compliance refers to how closely the actual product placement in stores matches the designed planogram. Non-compliance can lead to missed sales opportunities and skewed data. By regularly auditing planogram compliance, store owners can ensure that the intended product placement strategies are being executed correctly, thereby maximizing the effectiveness of the planogram. Ensuring planogram compliance helps maintain consistency across multiple stores, leading to better sales predictability and customer experience.
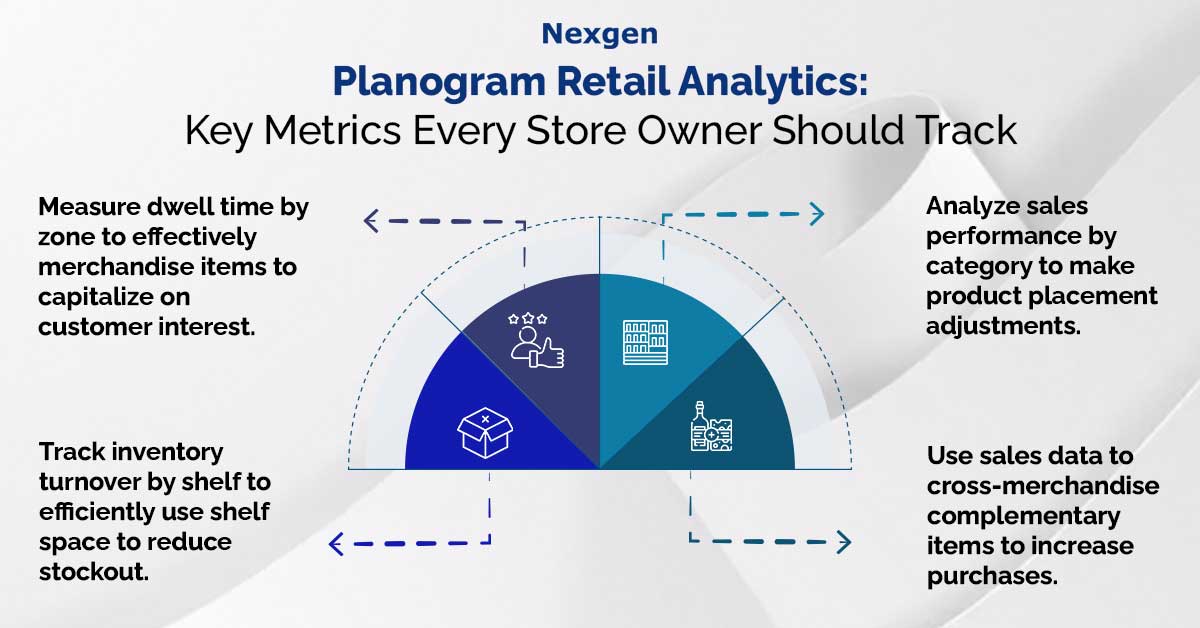
- Inventory turnover by shelf: Inventory turnover is a vital metric for overall retail performance, and when broken down by shelf, it can offer insights into how well products are moving in specific areas of your store. High turnover rates in certain areas suggest strong product demand and effective placement, while low turnover rates may indicate the need for a planogram adjustment or promotional support. Tracking inventory turnover by shelf ensures that your most valuable shelf space is used for products that sell quickly, reducing holding costs and minimizing the risk of obsolete stock.
- Sales per square foot by category: This metric combines the concept of sales per square foot with category performance, giving a more granular view of how different product categories contribute to overall sales. By analyzing this data, you can determine if certain categories are underperforming relative to the space they occupy and make informed decisions about reallocating space to more profitable categories. Understanding sales per square foot by category helps optimize category management, ensuring that space allocation aligns with consumer demand and sales potential.
- Cross-merchandising effectiveness: Cross-merchandising involves placing complementary products together to encourage additional purchases. For example, placing coffee makers near coffee beans. Analyzing the effectiveness of these strategies through planogram analytics can reveal whether certain product pairings are driving incremental sales. If the data shows strong performance, you may consider expanding these cross-merchandising efforts.
- Dwell time by zone: It refers to the amount of time customers spend in different areas of your store. By tracking dwell time in relation to product placement, you can gain insights into which zones are attracting the most attention and which may need improvement. Longer dwell times in high-traffic areas often correlate with higher sales, but it's important to ensure these zones are effectively merchandised to capitalize on customer interest.
Overview of Nexgen POG
Nexgen POG is a robust and user-friendly cloud-based visual merchandising tool. It is designed for quick and efficient planogramming with minimal effort. Planogram in retail can be designed by easily dragging and dropping the products. The multi-device compatibility feature of POG allows you to obtain, share and edit planogram on any device, including your phone. It helps in designing store-specific planograms for increased product visibility and sales.
Get Your Free Trial Now!
